Reading Linux’s TOP Screen
The top command in Linux provides information about the top CPU processess and provides performance information. The processes displayed are sorted by CPU usage with the information updating by default every 3 seconds. Top also displays information about memory and CPU waiting for I/O. Below is a line-by-line explanation of the top screen.
To find out how many CPUs the system has:
# less /proc/cpuinfo
First Line
The information displayed on the top line of top can also be displayed by itself using the uptime command.
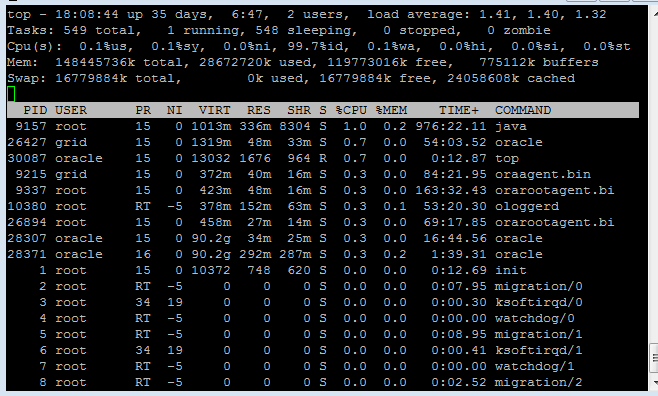
top - 18:08:44 up 35 days, 6:47, 2 users, load average: 1.41, 1.40, 1.32
top - 19:44:25 |
The Top command’s title and the current server time. |
up 11 days, 10:28 |
Uptime for the server. |
2 users |
Number of users currently logged on. |
load average: |
CPU average load in the last 1 minute, 5 minutes and 15 minutes. Pay more attention to the 5 and 15 minute load averages. Single CPU An average of 1 means that the CPU is utilized at 100%. A good load average would be .7 or 70% A load average of 1.40 means that 100% is currently being utilized with another 40% of what would be considered 100% is still waiting. Multiple CPU For every CPU, you have 100% utilization for every load average of 1. For a dual-core system, a load average of 2.00 is 100% on both CPUs. A load average of 1.00 would be 50% utilization. |
Second Line
This line is actually pretty self-explanatory, except for zombie processes. A zombie process is one that was started by a parent process and finished execution. It remains in the process list while the parent process is notified. Once the parent process gets the information needed from the child process, it is removed from memory. Zombie processes should not stick around very long, so if they are, there may be something wrong with the program creating them.
Tasks: 549 total, 1 running, 548 sleeping, 0 stopped, 0 zombie
Third Line
Cpu(s): 0.1%us, 0.1%sy, 0.0%ni, 99.7%id, 0.1%wa, 0.0%hi, 0.0%si, 0.0%st
0.1%us |
CPU% used by USer processes. User processes are anything not belonging to the kernel. Databases and web servers would be found here. |
0.1%sy |
CPU% used by SYstem processes, i.e. running the kernel. This includes the process scheduler, creating child processes, allocating memory or I/O operations. This number should be very low except during peak times like heavy I/O. |
0.0%ni |
CPU% used by NIced user processes. “Nicing” a process is changing it’s default priority from 0. By default, the nice level is changed to 10. 19 is the highest and has the lowest scheduling priority. -20 is the lowest and has the highest scheduling priority. |
99.7%id |
CPU% in an IDle state. us+ni+id should be close to 100%. If it isn’t, there is a problem. |
0.1%wa |
CPU% WAiting on I/O operations. This happens when an I/O operation is initiated and the CPU is waiting on results to be returned. It is idling as it waits but can do nothing else until the results are returned. See lsof, iostat and iotop to investigate I/O CPU Waits. |
0.0%hi |
CPU% spent dealing with Hardware Interrupts. Disks, network interfaces, etc. |
0.0%si |
CPU% spent dealing with Software Interrupts. Processes running on the system. |
0.0%st |
CPU% of STolen time of a virtual CPU waiting on another virtual CPU to be serviced. Applies only to virtual machines. |
Fourth Line
The fourth line shows information about memory. This information can also be found using the free command.
Mem: 148445736k total, 28672720k used, 119773016k free, 775112k buffers
148445736k total |
Total system memory not including a small amount the kernel reserves for itself.free+used=total |
28672720k used |
Memory currently used by the operating system. |
119773016k free |
Free Memory. |
775112k buffers |
Total memory used by buffers. This amount is included in the used memory. The memory used by buffers is memory used by programs. |
Fifth Line
Swap space is set aside on a hard disk and acts as a form of memory. Pages of memory are swapped back and forth between the system’s memory and this swap space. Swap space + physical memory = total virtual memory.
This information can also be found using the free command.
Swap: 8159224k total, 106516k used, 8052708k free, 5434940k cached
8159224k total |
Total swap memory configured. |
106516k used |
Swap memory currently being used. |
8052708k free |
Free swap memory. |
5434940k cached |
Amount of pages that are both in physical memory and in swap memory. |
The Process Table
Next follows the listing of those top CPU-utilizing processes. These are the columns shown with an explanation.
PID |
The process identifier; a unique identifier |
USER |
The user running the process |
PR |
The PRiority of the process |
NI |
The NIce value of the process (see nice above) |
VIRT |
The VIRTual memory used by the process. This is the total amount of memory available to a process. |
RES |
The non-swapped RESident or physical memory used by the process. |
SHR |
The SHaReable amount of the virtual memory. This is the portion such as libraries that are potentially shareable with other tasks. |
S |
The Status of a process. ‘D’ = uninterruptible sleep ‘R’ = running ‘S’ = sleeping ‘T’ = traced or stopped ‘Z’ = zombie |
%CPU |
This process’s share of the CPU Usage; the percentage of the CPU time used. |
%MEM |
This process’s share of the total physical memory currently in use. |
TIME |
The total amount of CPU time used by the process since it started. |
COMMAND |
The command line used to start the process or the name of the program. Use ‘c’ to toggle between the two. |
For more information on top use man top. (colon-q to quit)